New: Patchwork AI is here. Summaries, auto-triage and smart replies on every plan →
Get started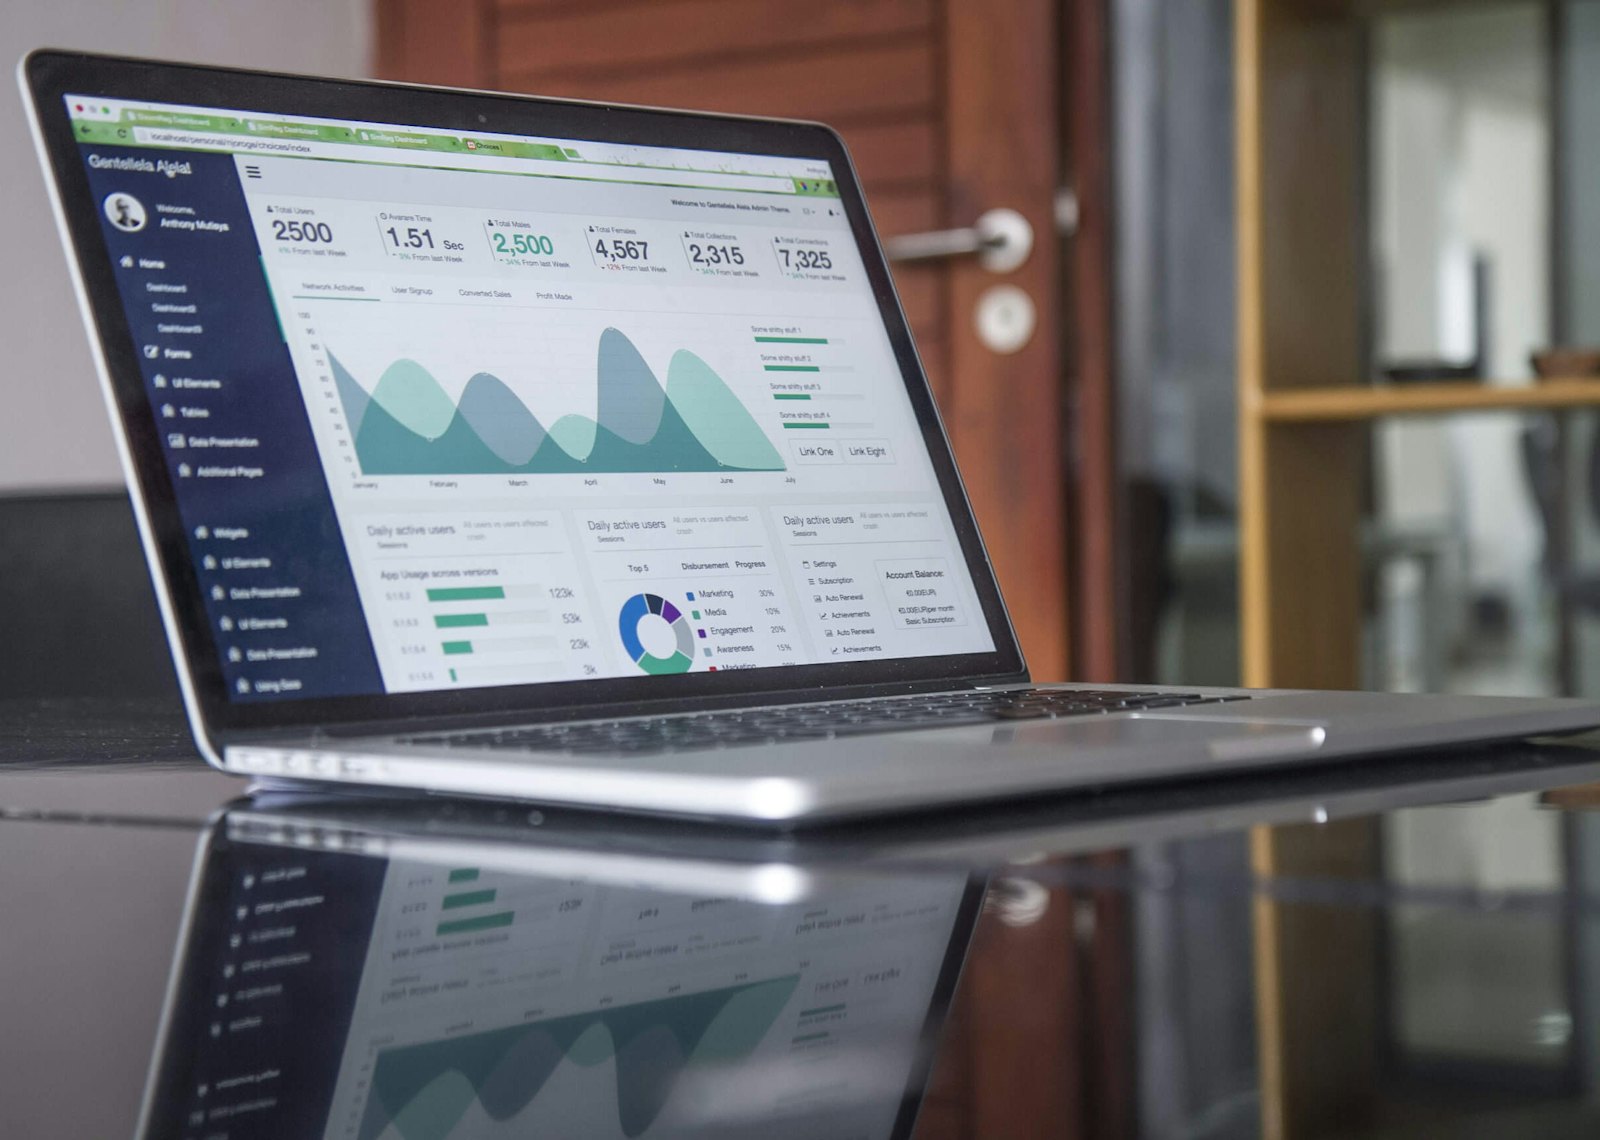

Dashboards & reporting
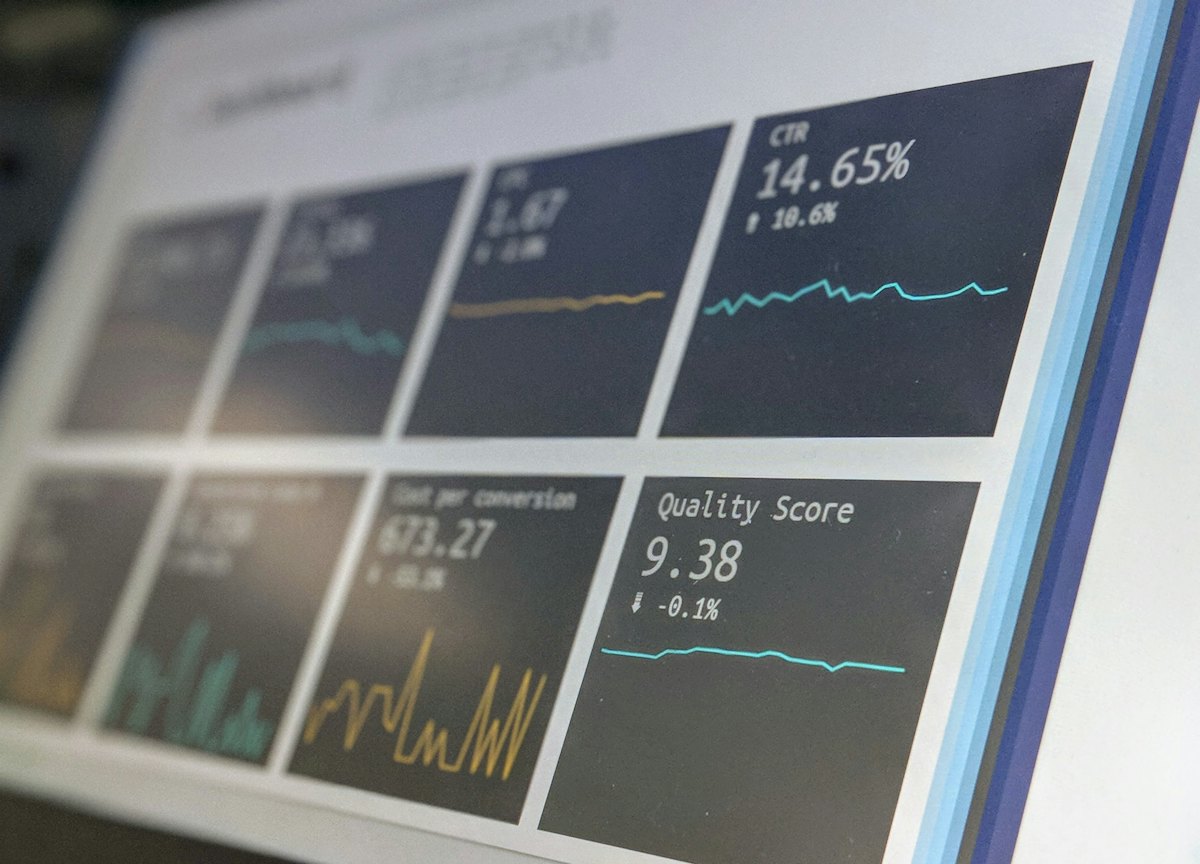
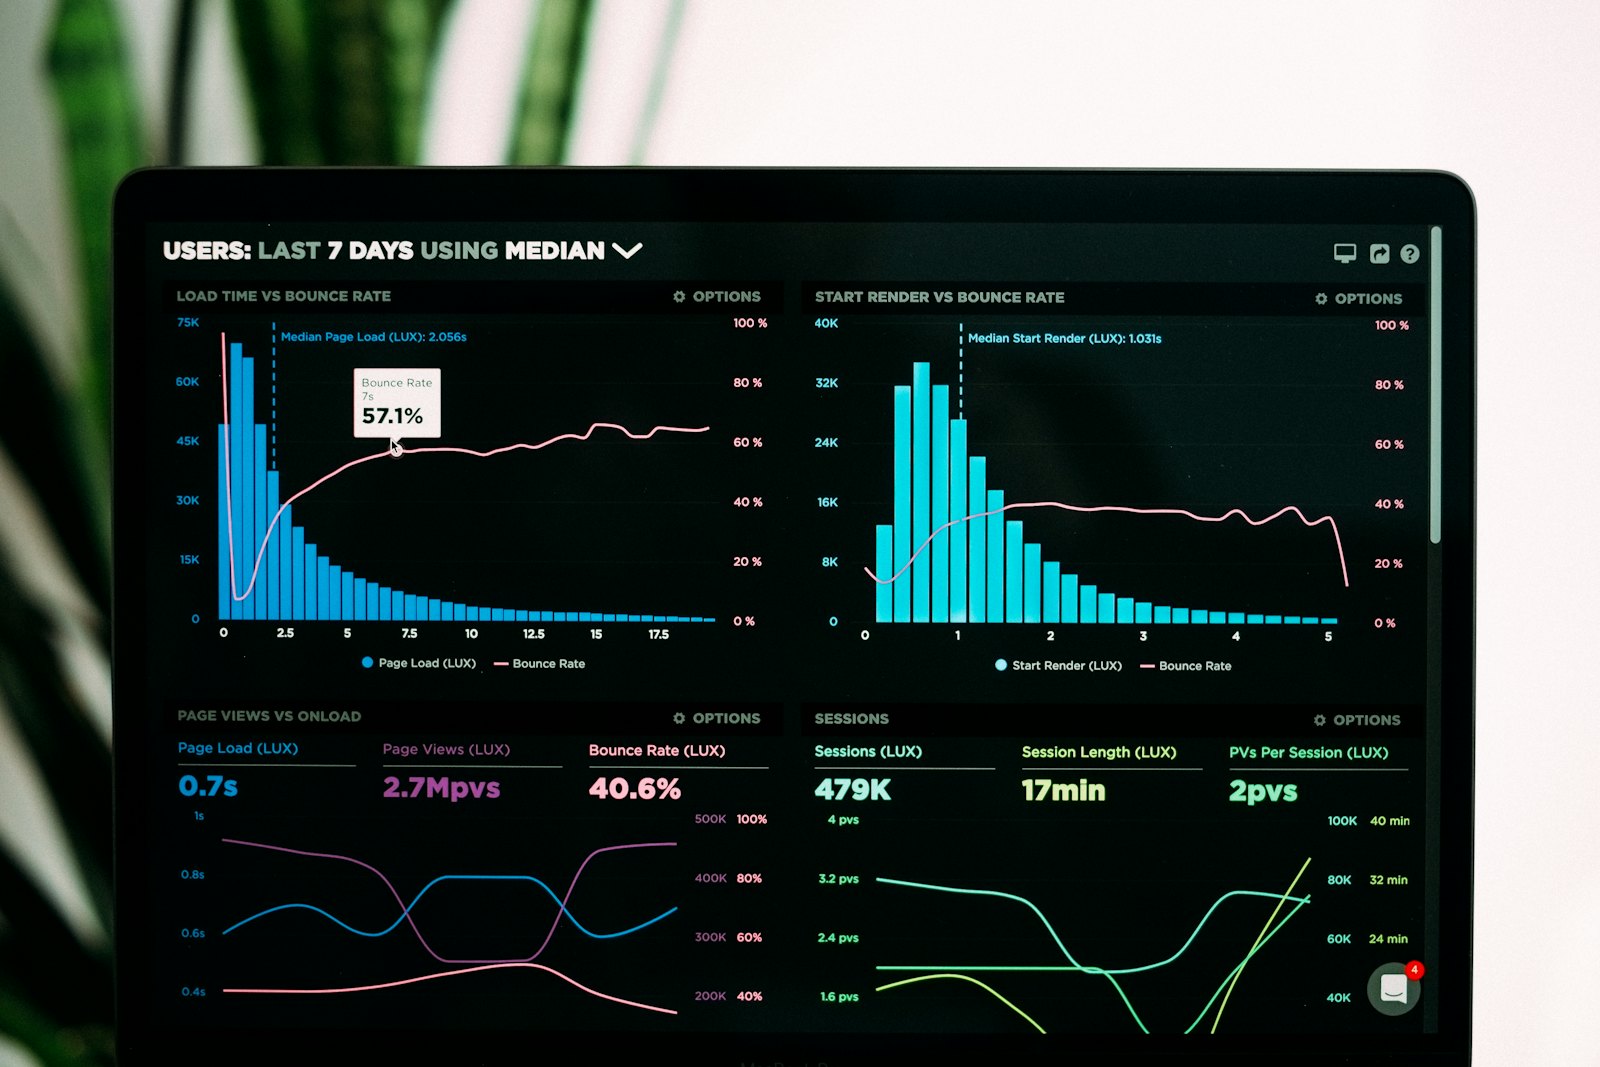
Live charts for workload, progress and cycle time, built in minutes.
Price
On request
- Who it's for
- Team leads & managers
- Type
- Core
SOC 2 Type II
Overview
Dashboards & reporting, explained.
Build dashboards from any data in Patchwork with drag-and-drop widgets. See who is overloaded, what is slipping and how long work really takes, then share a live link with leadership instead of writing another status report.
Highlights
- 0120+ chart and widget types
- 02Workload and capacity views
- 03Cycle time and throughput metrics
- 04Scheduled email digests
- 05Shareable read-only links
How it works
- 1
Start from a dashboard template
- 2
Add widgets and pick your data source
- 3
Filter by team, project or date range
- 4
Share it or schedule a weekly digest
Good to know
- Data refreshes in real time
- Export any chart as CSV or PNG
Questions? Call +44 20 4586 1200 and talk to our people.
Keep exploring
You might also like.
More from Patchwork that pairs well with this one.
 Insights01
Data warehouse sync
Stream workspace data to your warehouse for custom BI reporting.
 Planning02
Projects & boards
Plan work your way with lists, boards, timelines and calendars that stay in sync.
 Workflow03
Automations
Turn repetitive steps into rules that run themselves, no code required.
 Knowledge04
Docs & wikis
Write specs, meeting notes and handbooks right next to the work.
 Workflow05
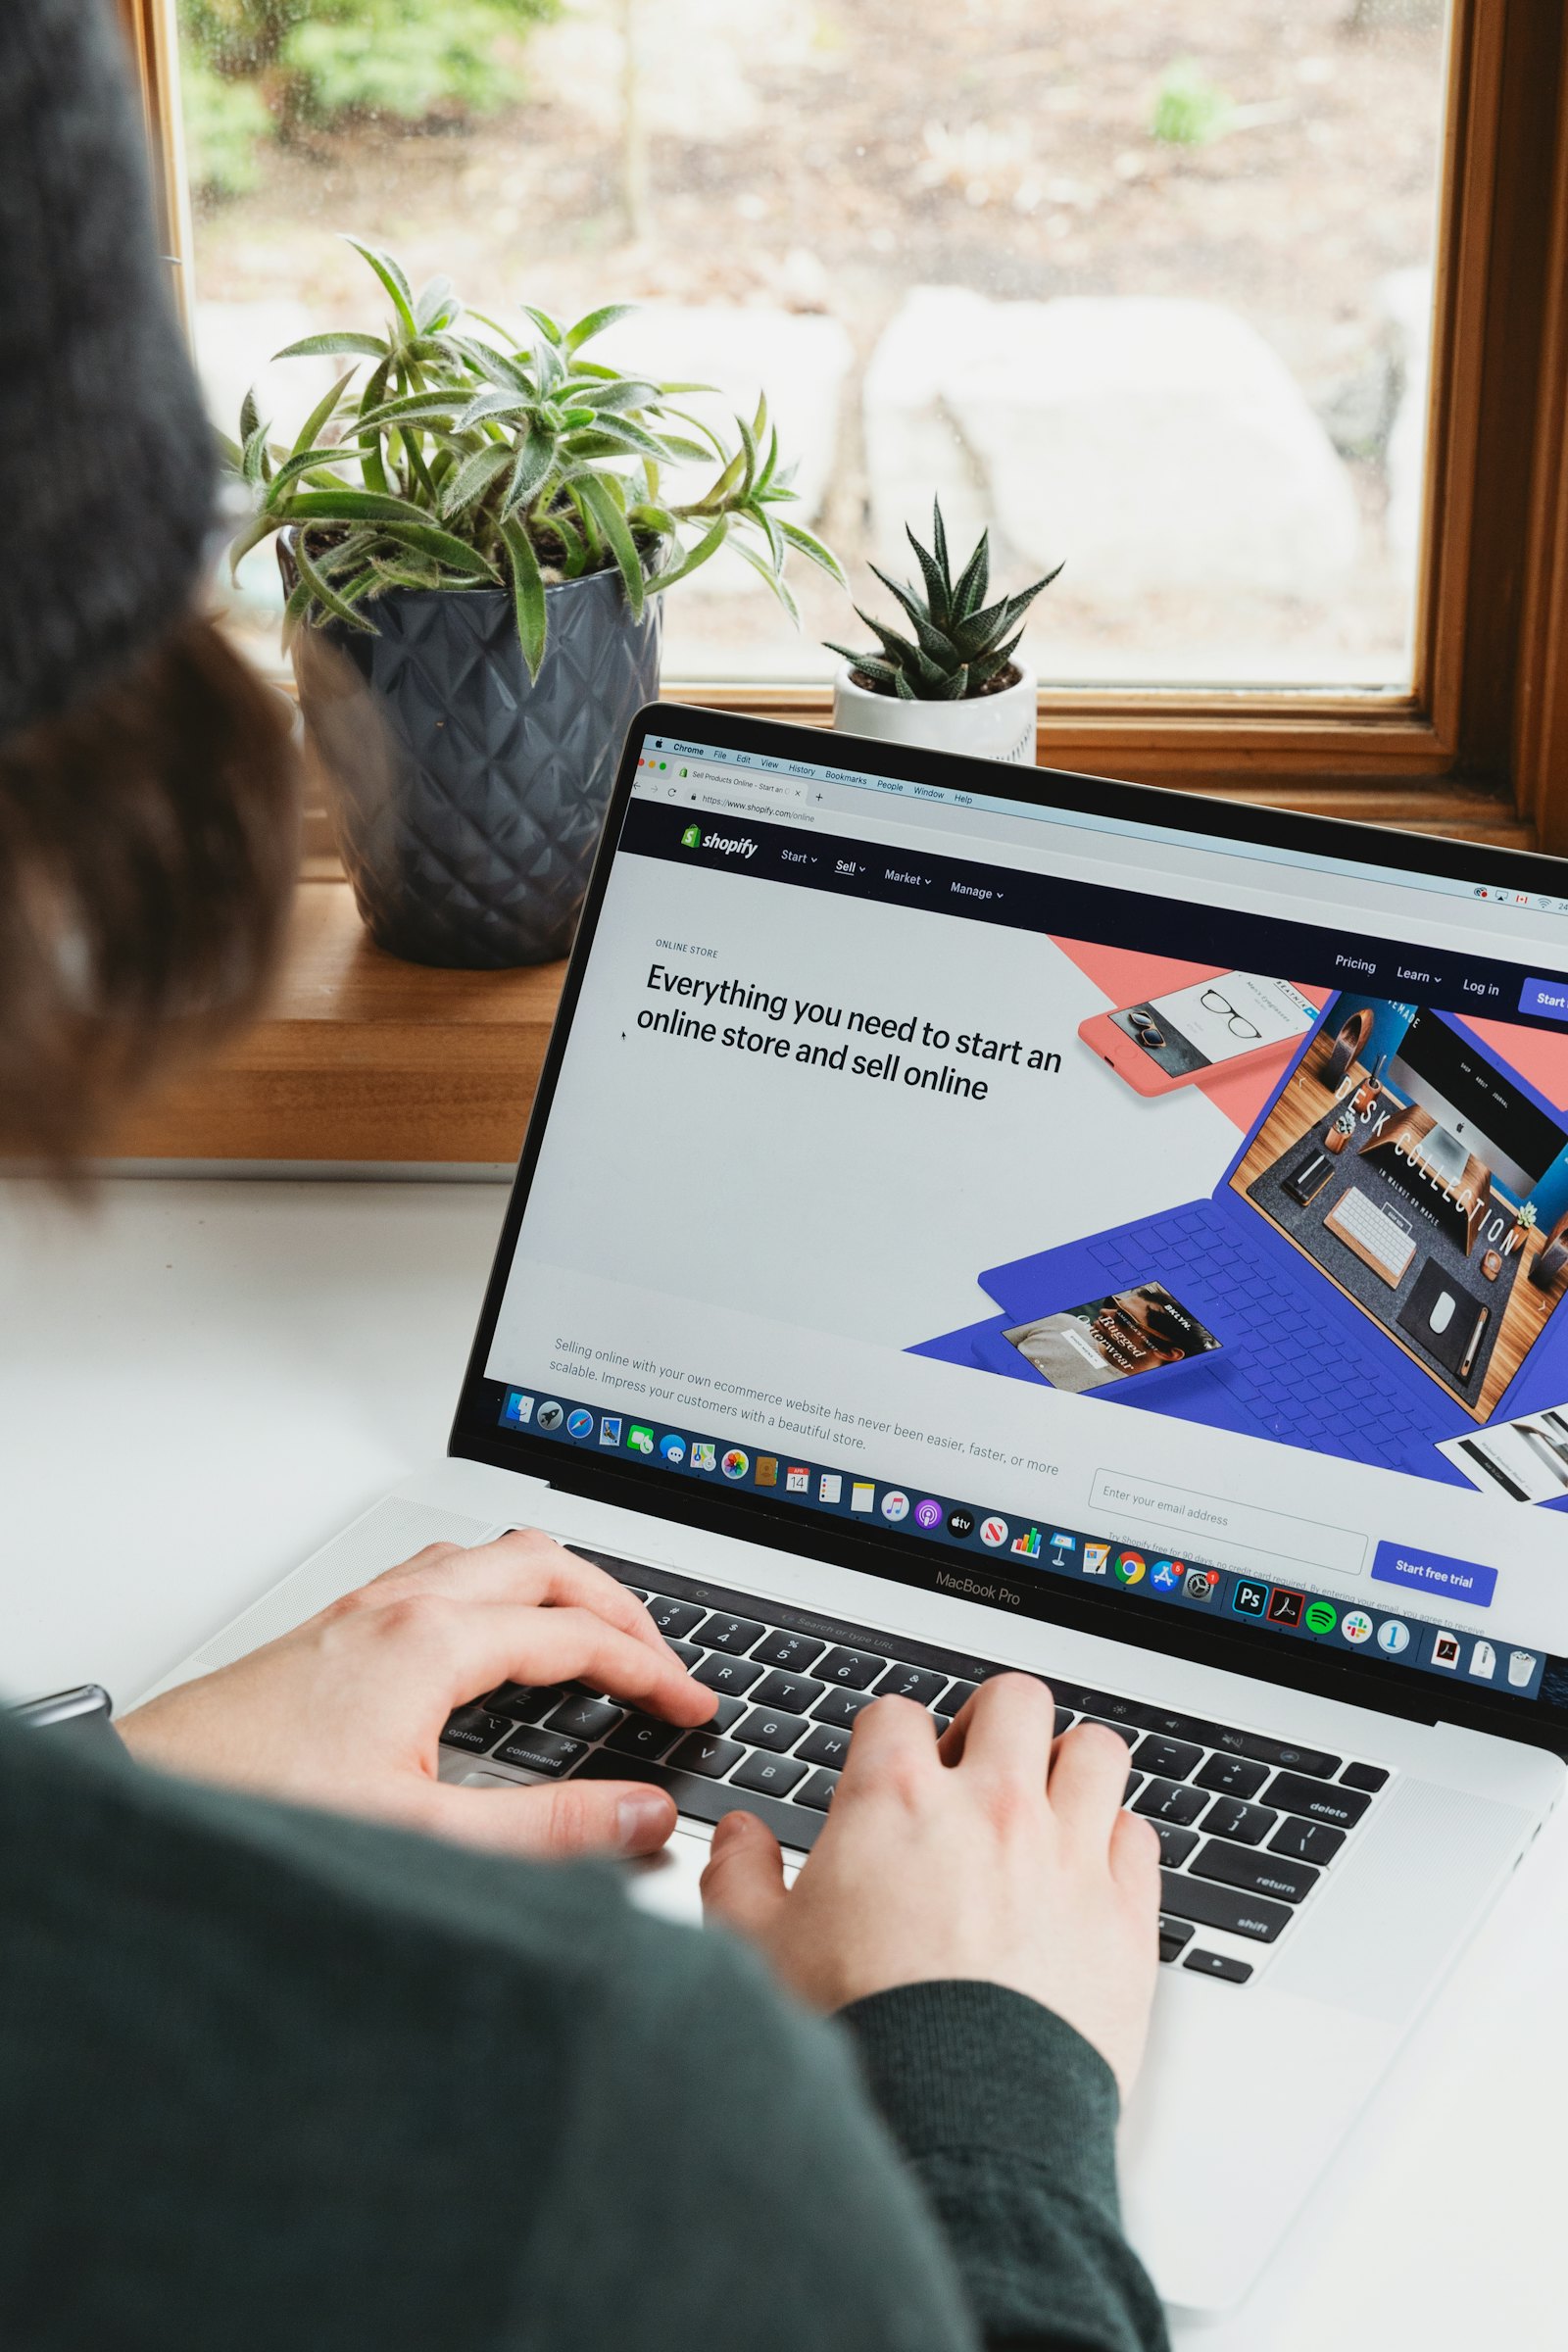
Forms & intake
Collect requests in a consistent format and route them to the right team.
 Platform06
Integrations
Connect the tools you already use with 150+ two-way integrations.
 Platform07
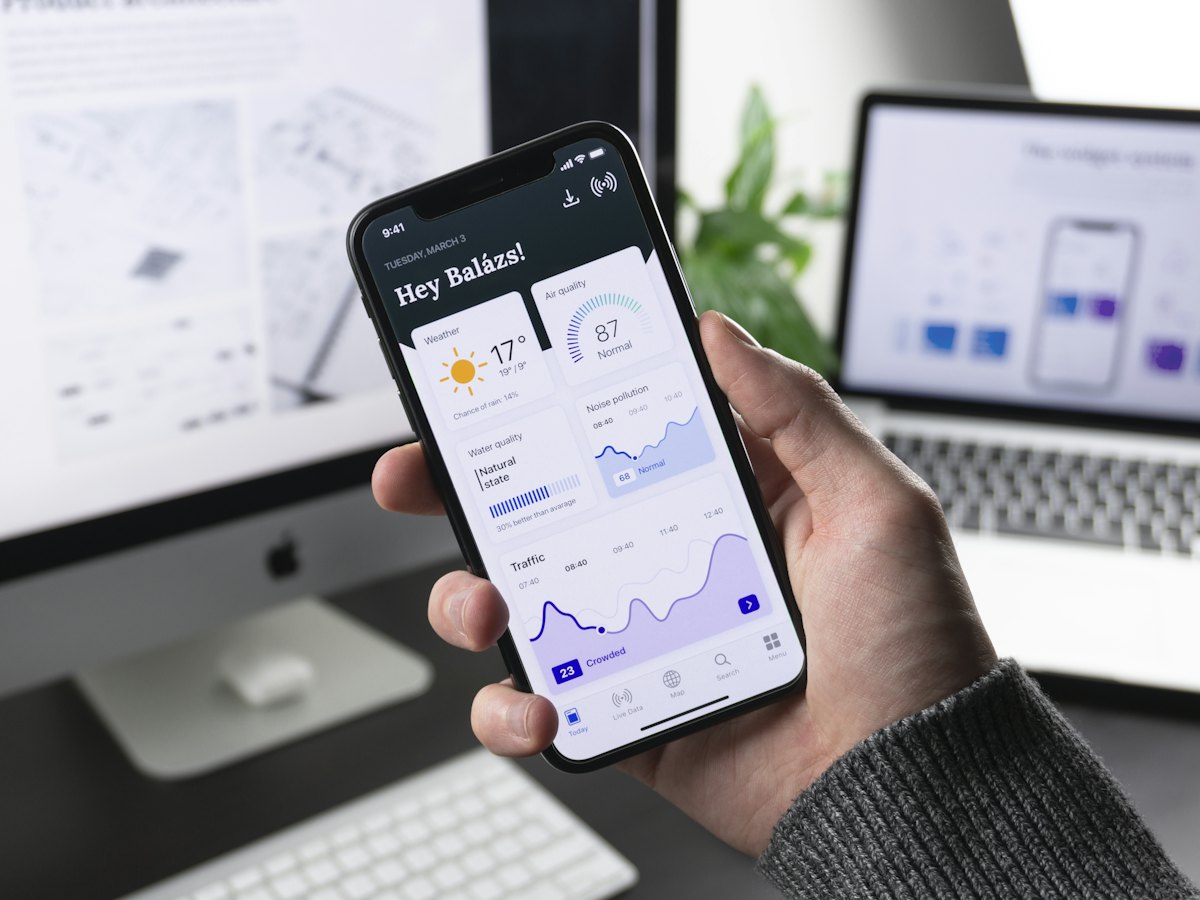
Mobile & desktop apps
Native apps for iOS, Android, Mac and Windows with offline mode.
 Planning08
Goals & OKRs
Connect daily work to company goals and track progress automatically.
“We replaced three tools and a lot of spreadsheets with Patchwork. Our Monday status meeting went from an hour to fifteen minutes because the dashboard already answers every question.”
Hannah Reyes · 4.8 average from teams
Get started
Ready when you are. Get started today.
Tell us what you need and our people will take it from there. It's quick, there's no obligation and we reply the same day.